Main Windows
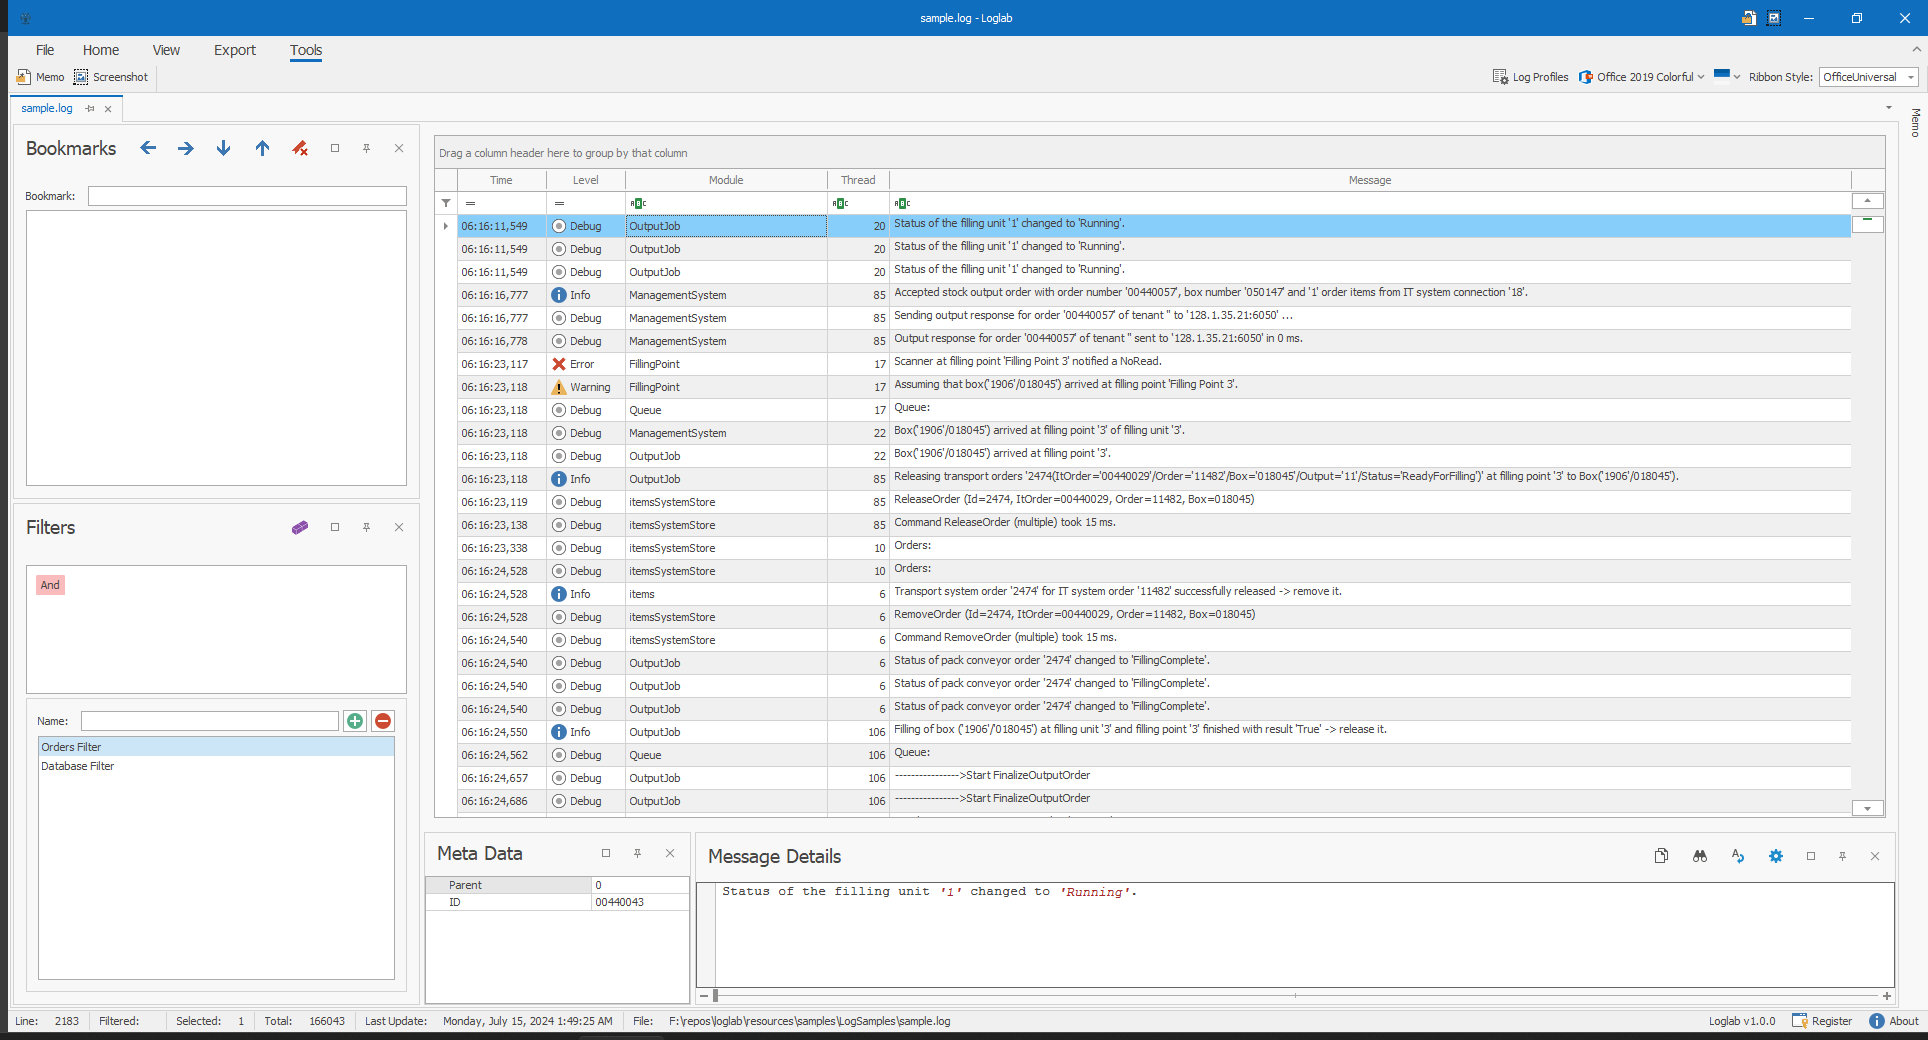
LogLab's interface is designed to provide an efficient and intuitive log analysis experience, with a layout consisting of several key components: the ribbon, main grid, bookmarks panel, filter builder panel, saved filters panel, and message details panel. Each of these components plays a vital role in streamlining the process of viewing, filtering, and analyzing log entries.

Key Components:
-
Ribbon: The ribbon is located at the top of the LogLab interface, providing quick access to various tools and features. It includes buttons for common actions such as opening log files, exporting data, applying themes, navigating log entries, and more. The ribbon is organized into tabs for easy navigation.
-
Main Grid: The main grid is the central area where log entries are displayed. It provides a detailed, tabular view of your log data, allowing you to scroll through and examine individual entries. The main grid supports sorting, searching, and selecting log entries for further analysis.
-
Bookmarks Panel: Located on the side of the interface, the bookmarks panel lists all the bookmarks you have created. It allows you to quickly jump to important log entries that you have marked for easy reference. Bookmarks can be added, edited, or removed as needed.
-
Filter Builder Panel: The filter builder panel is used to create custom filters for your log data. You can define conditions based on log entry attributes such as severity, date, and content. This panel helps you narrow down the log entries to those that meet specific criteria, making it easier to focus on relevant data.
-
Saved Filters Panel: This panel displays all the filters you have saved for future use. You can apply these filters to the main grid to quickly view log entries that match predefined conditions. Saved filters can be managed by editing or deleting them as needed.
-
Message Details Panel: The message details panel provides a detailed view of the selected log entry. When you select a log entry from the main grid, the message details panel displays additional information such as the full log message, timestamps, and any other relevant data. This panel helps you gain a deeper understanding of individual log entries.
Layout Overview:
- Ribbon: Located at the top, providing access to tools and features.
- Main Grid: Central area displaying log entries in a tabular format.
- Bookmarks Panel: Sidebar showing a list of bookmarked log entries.
- Filter Builder Panel: Sidebar for creating and applying custom filters.
- Saved Filters Panel: Sidebar listing all saved filters.
- Message Details Panel: Bottom or side panel displaying detailed information about the selected log entry.